440
Views & Citations10
Likes & Shares
Background: Environmental variables may have an impact on many illnesses.
Objective: To correlate life expectancy (LE), ecological, demographical/social, economic, life style variables (overall defined as LEEDELs) with the most common illnesses in those 49 countries (49SC) considered reliable by WHO in terms of Age Standardized Death Ratio (ASDR) registry.
Material and Methods: ASDRs of 34 diseases (17 non cancer and 17 cancers), retrieved from WHO records, were correlated with LEEDELs in the years between 2000 and 2016.
Results: LE and population increase were respectively 4.5 years and 19.7 %. Most of the illnesses showed a significant decrease, a part from pancreas cancer (+7%) and Alzheimer (+ 72 %), while HIV, digestive diseases, prostate and brain cancers were not significantly modified.
In general, the modifications (positive or negative) were more correlated with those LEEDELs indicative of welfare status (GDP, cars, internet, cell phones), while social/demographical and ecological variables showed a minimal impact. The pancreatic cancer was positively correlated with cell phones.
Conclusions: In the 49 SC, the welfare variables influence positively most of the ASRDs. TBC, STD, diarrheal, peptic ulcer among non-cancer illnesses while stomach, liver and cervix among cancers were bound to a lower economic status. Pancreatic cancer was positively correlated with cells.
Keywords: Ecology, Demography, Economy, Cancers, Diseases, Pancreatic cancer
INTRODUCTION
The relationship between LE, ecology, demography/social, economy and life style (complexively reported as LEEDELs variables) has been matter of so many reports and debates that it will be very difficult to summarize all of them, a part from the common statement that humans are spoiling the earth and compromising the life of the new generations [1-3], in terms of loss of biodiversity [4,5], climate emergency [6], and CO2 emission [7].
How has the belief come about that our ancestors have done wrong in trying to provide a better life for us.
Is it true that in bringing a steak, vegetables and fruits on the family table we have compromised the life of our grandchildren? How is it a crime to provide comfort to our families by heating the houses in winter and providing some fresh air in hot summer?
Perhaps is necessary to focus our attention between progress and health.
The aim of the present study was to analyze, in the period between 2000 and 2016, the correlations between the Average Standard Death Ratio (ASDRs) and the most common diseases with LEEDELs, in those countries considered reliable by WHO in terms of data registration.
MATERIAL AND METHODS
Criteria of choice for the variables and time frame
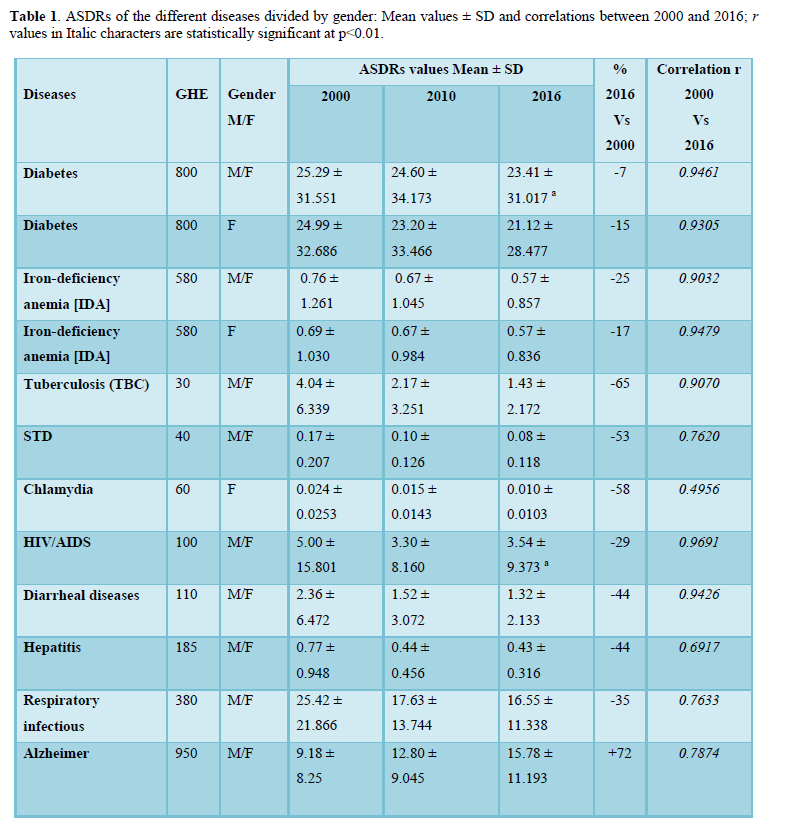
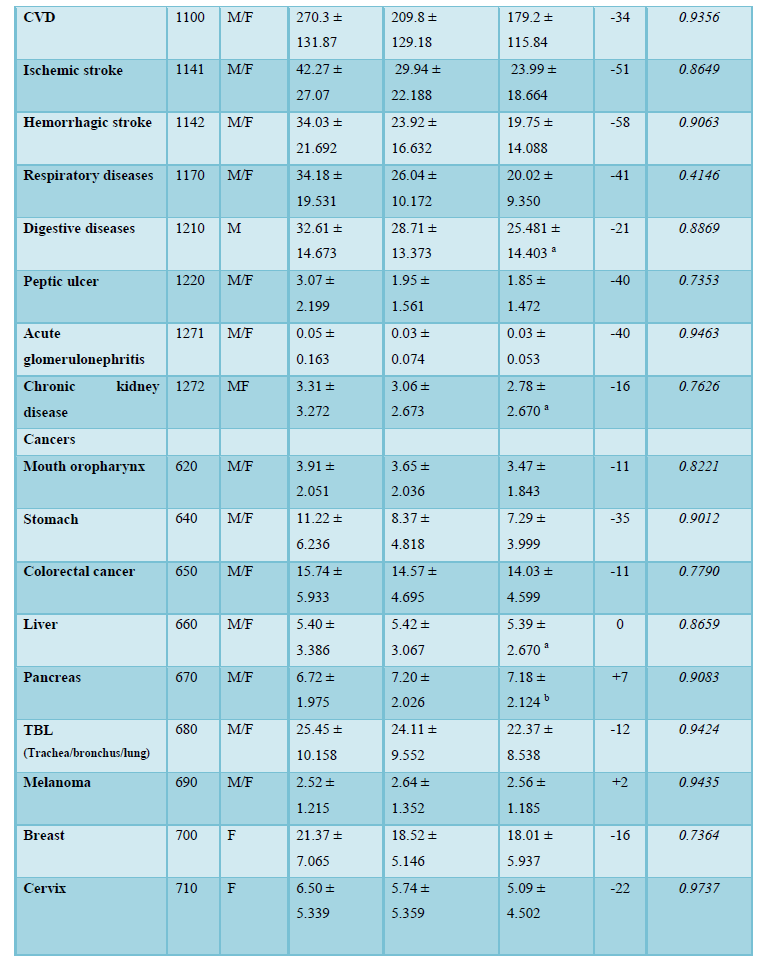
The Age-Standardized Death Rate x 100,000 population (ASDRs) were considered for some diseases (non-cancer and cancers, Table 1) were compared to some of the LEEDELs (Table 2).
ASDRs are free of the bias related to age distribution unlike crude data or prevalence/incidence measures. The ASDRs data listed as Global Health Estimates 2016 and published in 2018 were used [8].
The ASDRs do not consider the number of inhabitants in the country with the consequence that values in small countries (e.g., Bahamas- about 0.4 million inhabitants) have the same weight as for larger countries (e.g. USA-about 322 million inhabitants), which can create a bias in the average values of the 49 SC.
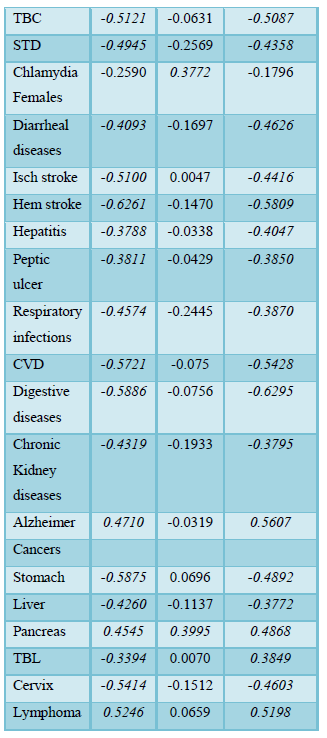
However, despite the increase of the population, ASDRs remain significantly correlated (as reported in Table 1; r> 0.3772; p < 0.005). For this reason, ASDRs values were considered sufficiently reliable.
For all the variables the values were relative to both genders, a part from prostate cancer which was in relation to males, and breast and cervix cancers concerning females only. Seventeen ecological, environmental and demographic variables limited to 2016 were also taken into consideration [8-10] for the correlation with the different illnesses.
The list and the criteria of choice for the countries
In total, the countries listed by WHO in terms of ASDRs are 191.The data used for correlations were relative only to those 49 countries (selected countries or SC) considered by WHO “with high completeness and quality of cause-of-death assignment” that “may be compared and time series may be used for priority setting and policy evaluation” [7].
List of the countries
The following 49 SC countries were considered:
Armenia, Australia, Austria, Bahamas, Belgium, Brazil, Brunei, Canada, Chile, Croatia, Cuba, Czechia, Denmark, Estonia, Finland, France, Germany, Grenada, Guatemala, Hungary, Iceland, Ireland, Israel, Italy, Japan, Kyrgyzstan, Latvia, Lithuania, Luxembourg, Malta, Macedonia, Mauritius, Mexico, Moldova, Netherlands, New Zealand, Norway, Romania, Saint Vincent & Grenadinas, South Korea, Trinidad & Tobago, United Kingdom, USA, Uzbekistan.
Data collection
The values up to the fourth decimal place were taken from the WHO records. For LEEDELs only the values of 2016 were considered because of very high correlation (r> 0.9) with previous years (2000 and 2010).
For LEEDELs the variables were taken from the Atlante Geografico DE Agostini 2016 Ed De Agostini Novara Italy [9] and by CIA World Factbook 2016 [10].
Life expectancy, ecological, demographic/social, economic, life style variables (LEEDELs)
The following variables were chosen:
Life expectancy (LE): years
Population density: as number of subjects/km2
Urban population: as % in comparison to the total population
GDP/inhabitant (Gross Domestic Product/inhabitant) as total values/inhabitants (USD) of goods and final services related to economic activities, capital investments
Unemployment: as % of people looking for a job in relation to the labor force
GDP 1: GDP rate as % in relation to primary industry bound to agriculture, forests, livestock, fishing
GDP 2: GDP rate as % in relation to industry, mining and construction
GDP 3: GDP rate as % in relation to commerce, transportation, communication, tourism, and insurance
GDP 2+3: sum of the rates as % related to GDP 2 + GDP 3
Education: as % of the investments in public and private instruction in relation to GDP
Hospital beds: number of hospital beds/1000 inhabitants
PM: particulate matter (PM2.5 and PM10) in mcg/m3 measured in cities with > 100,000 inhabitants
Forests: rate as % of the country surface covered by forests
Forests Km2: square kilometers of forest/1000 inhabitants.
Cars: number of cars/1000 inhabitants
Cell: number of cell phones/1000 inhabitants
Internet: number of people with internet connection/1000 inhabitants.
Statistical evaluation
For all the variables the mean values and dispersion indexes were calculated.
The level of p
In terms of correlations among variables, following a linear Pairwise Correlation analysis, the presence of some or more out outlier may compromise the r values. The impact of the outlier was minimized using the Robust fit [11] further adjusted following the method M of Huber [12].
The JMP14 Pro of SAS Institute was used for the analysis.
RESULTS
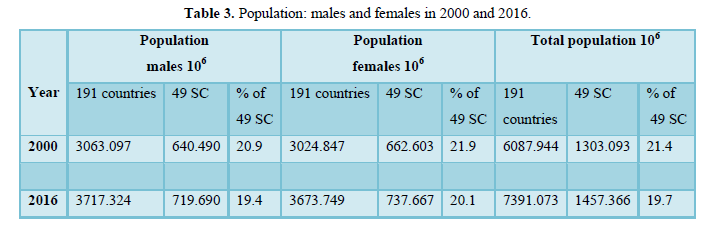
The data concerning the population increase for both genders were reported in Table 3.
The 49 SC represented between 19.4 % and 20.1 % of the world population. In the 191 SC between 2000 and 2016 the population increased by 21.4 %, whereas in the 49 SC the increase was 11.8 % only.
The modifications of the ASDRs for the selected diseases were reported in Table 1. The significant correlations between 2000 and 2016 indicate that the values of the different diseases are constant over time. This condition allows to consider the values of 2016 as a reliable mirror for all the previous years. In the period 2000 Vs 2016 LE increase of 5.7 % while the other LEEDLEs variables showed very different trends (Table 2).
Most of the common illnesses were significantly reduced, a part from Alzheimer which increased by 72%.
The average reductions of HIV, diarrheal diseases, and chronic kidney diseases were not statistically significant due to the large variance. In relation to cancers, a statistically significant reduction was found for all cancers with the exception of liver, and brain cancers showing almost identical ASDRs during the entire period. The only cancer showing a significant increase was the pancreatic cancer (+7 %).
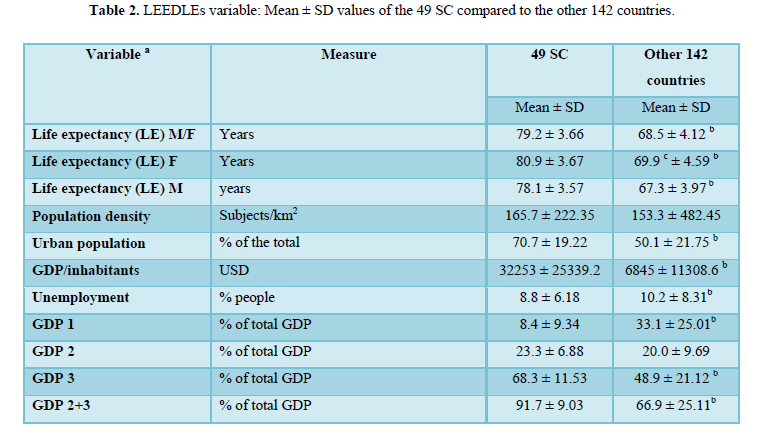
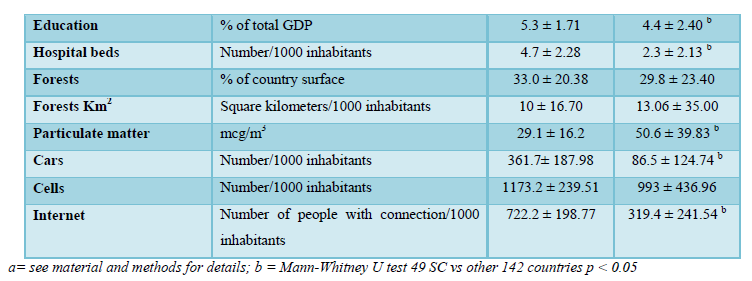
Limited to year 2016, the LEEDLEs variable list comparing the 49 SC with the rest of the 142 countries was reported in Table 2.
The differences between the two blocks of countries are consistent for most of the variables, and not significant only for some of the ecological variables (forests) and cell phones.
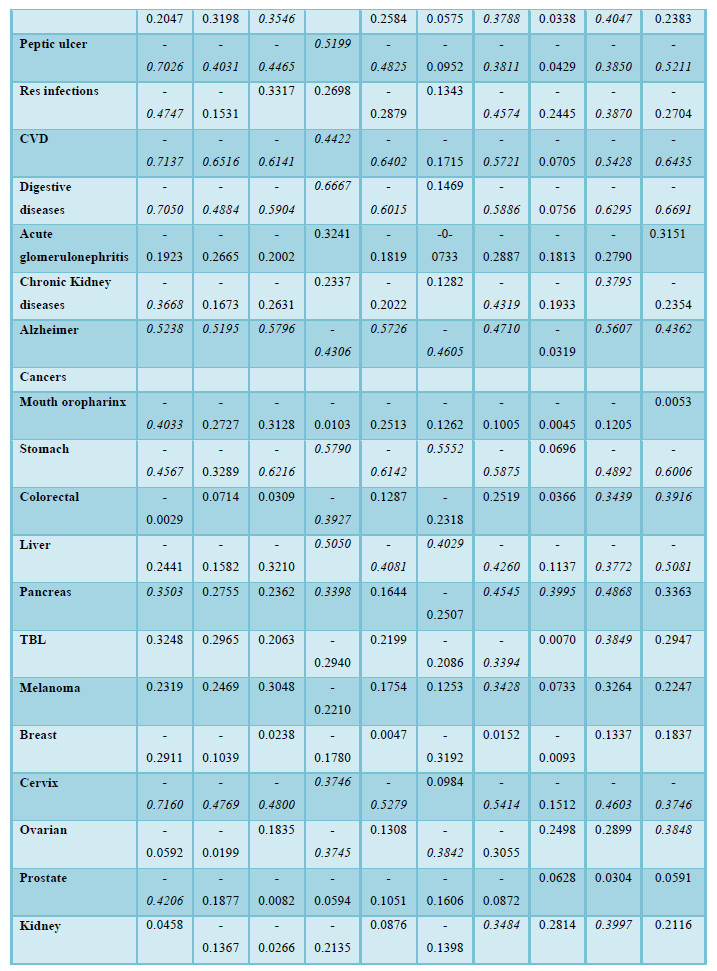
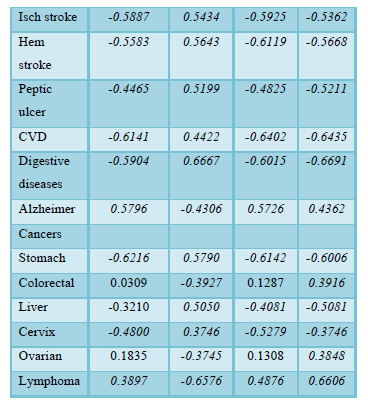
The correlations between illnesses (non-cancer and cancers) and the LEEDLEs variables were reported in Table 4.
The negative correlation indicates that the increase of the disease corresponds to a lower value of the variable, at the opposite a positive correlation corresponds to the increase of the variable. As an example: Alzheimer’s disease increases with the increase of LE, GP/inhab and GP2+3 (high profit), internet connections and cars, while it decreases in case of GP1 (low profit) and PM (particulate matter).
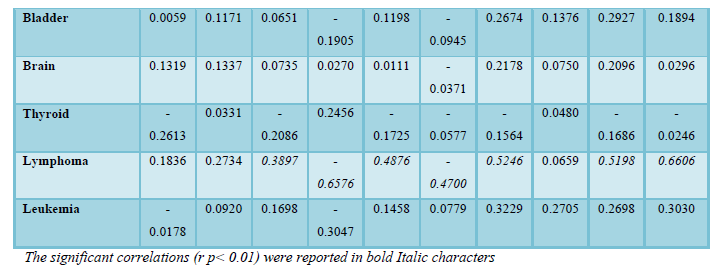
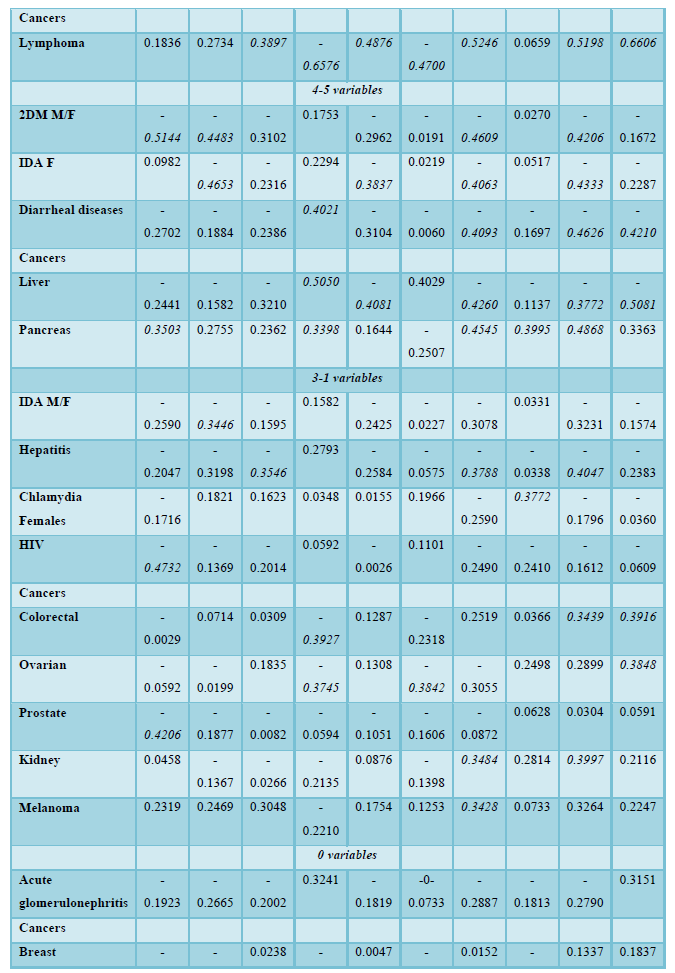
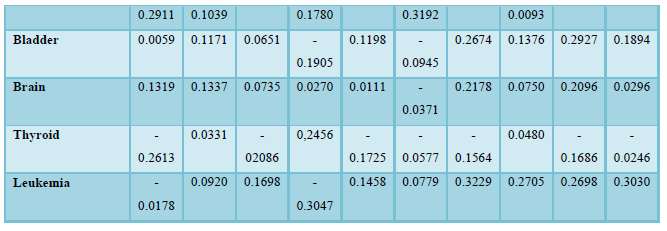
For a more readable evaluation, the correlations between LEEDLEs Vs different illnesses, were reported in Table 5, according to the number of variables showing statistically significant r correlation (0.338 as cut off for p<0.01), starting from diseases showing the highest number of correlations (9) to the lowest (0) .
A block of 8 illnesses showed an almost identical tendency with negative correlations for LE, % of urban population, GDP/inhabitants, % GDP 3, % GDP 2+3, internet connections/inhabitant and positive correlation for % GP1. The only diseases with a completely different pattern was Alzheimer, characterized by specular/opposite correlations for all the variables compared to the rest of the block, with the addition of PM which showed to be negative. Lymphoma also showed a pattern similar to Alzheimer a part from LE which was not significant.
PM showed a positive impact for ischemic stroke and stomach cancer only. All the other diseases with a number of significant correlations between 7 to 1 each seemed to a different pattern for some of the variables (see discussion).
A block of 6 illnesses had no correlation with any of the LEEDLEs, meaning they seemed to develop independently from the environmental variables.
For a more comprehensive overview, the different LEEDLEs was also summarized separately and reported in Tables 5-9.
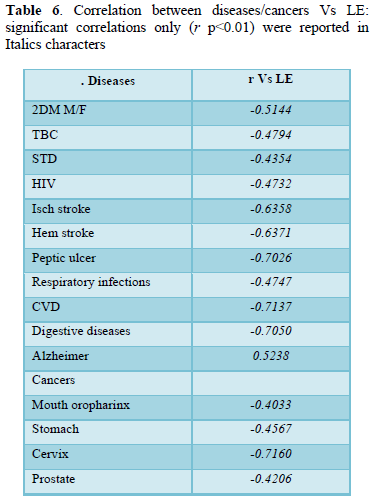
Life expectancy
In term of LE dependence the results are reported in Table 6.
All the correlations for the listed illness with LE were negative, with the exception of Alzheimer’s disease.
Ecological variables
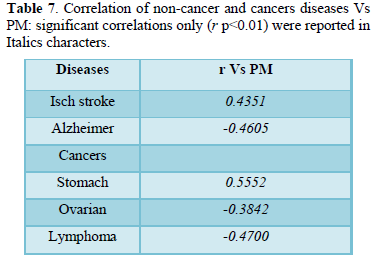
The classical ecological variables, such as population density, forests % in the country, and forests km2/1000 inhabitants, did not reach the cut off correlation of p < 0.01 with the listed illnesses, and were not reported in the table. The only correlated variable was PM as reported in Table 7.
It seemed that PM increases the ASDRs in the case of ischemic stroke and stomach cancer, while an opposite effect was found for Alzheimer’s disease, ovarian cancer and lymphoma.
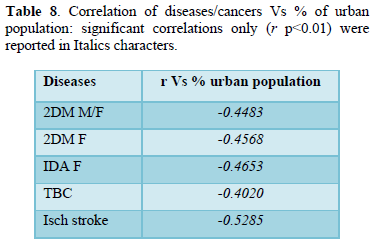
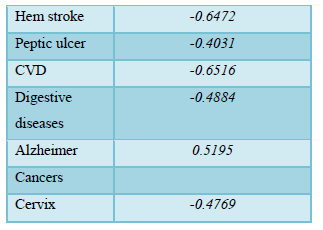
Demographic/social variables
The % of urban population was the only demographic variable showing some significant correlation, while all the others, hospital beds, and education investments were found inconsistent.
Data were reported in Table 8.
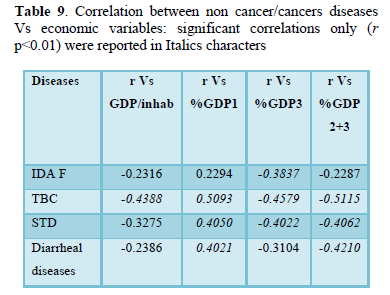
Economic variables
GDP/inhabitant and % of GP1, GDP 3 were the variables showing some significant negative correlation.
GDP 2 was not significantly correlated and was summed up with GDP 3. This last variable is complementary to % GP1. Data were summarized in Table 9.
A block of 8 illnesses (TBC, STD, ischemic stroke, peptic ulcer, digestive diseases, liver, stomach, and cervix cancers were showing a similar correlation pattern: negative for GDP/inhabitants and % GPD 3, and positive for the other GDPs (1 % and 2+3 %). Lymphoma and Alzheimer’s disease were the only diseases with ASDRs specular to the other. Colorectal cancer seemed influenced by GDPs only (positive for 1% GDP and negative for % GDP 2+3).
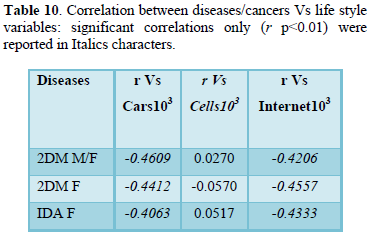
Life style variables
These variables seemed to be the most discriminant for non-cancer and cancer diseases accounting for 21 different illnesses as reported in Table 10.
The ASDRs of most of the illnesses (18/21) were found to be negatively correlated with cars and internet connections, while Alzheimer’s disease, pancreas cancer, and lymphoma showed specular positive correlations.
Pancreatic cancer and chlamydia were the only illnesses showing a positive correlation with cellular phones.
DISCUSSION
In a previous study, a more sophisticated analysis (stochastic and non-stochastic) was done in the 191 countries (the complete list according to WHO) without considering the ASDRs [13]. In terms of LEEDLEs, similar correlations were found for GDPs, PM, and for those variables characteristic of developed countries (cars, mobile phones, internet connections), while the classical ecological variables were in consistent in terms of LE.
The results of the present investigation have the limitations due to the differences between the 49 SC and the rest of the 142 countries in terms of LEEDLEs (see Table 2).
This means that the results cannot be taken as a worldwide picture, and have to be considered within the limit of the 49 SC which represent about 20 % of the total population.
The choice of ASDRs as main variable can be a further limitation, because each disease could be concomitant with other illnesses which may precipitate the death. Furthermore, for chlamydia it was not possible to differentiate between Chlamydia trachomatis or Chlamydia pneumoniae since no data were available.
Despite these limitations, some interesting observations can be drawn from the analysis. Between 2000 and 2016 in the 49 SC the ASDRs of almost all the diseases were significantly reduced a part of liver, kidney, brain cancer, which were not significantly modified, while pancreatic cancer was increasing by about 7 %. The overall improvement of the diseases can be to the therapies prolonging the survival, and also some positive modifications of the environment cannot be excluded.
The aspect of environmental modifications opens the door to many hypotheses. All the ecological variables, with exception of PM (see later), seemed not important. LE increase together with the decrease of almost all the illnesses witness that the present environment does not seem so negative. One may speculate about the quality of life which was not considered in the present study. However, the human needs are primarily to stay alive and to improve the welfare of immediate and future generations. The second need is food, and the choice to substitute forests with crops is consequential on that. If it is true that pollution has been the consequence of this, it is also true that starvation has been strongly reduced in the last 20 years, and the aim of FAO Sustainable goals WHO was to allow all humans by 2030 to have access to sufficient food for surviving (Zero Hunger Challenge) [14].
The challenge will be to reach this goal reducing the pollution, accomplishing this task with the contribution of every generation.
Among the environmental variables, those related to welfare (GDP 2+3, cars, internet, cells) were increasing LE. The inconsistency of investment in education and the hospital beds in terms of LE, can be considered in the light of the profit: once resources are sufficient, it is much easy to take advantage of the available institutions (school, hospitals) despite some limitation.
From the analysis it seems evident that LE was reduced either by non-cancer illnesses (TBC, strokes, peptic ulcer, digestive diseases, CVD, diabetes type 2, HIV, STD) and also by some cancers (stomach, cervix, and prostate), but for all the other illnesses no correlation was found. Some of the illnesses (16/34) were shown to be reduced by the improvement of life style (see Table 10), Alzheimer’s disease and lymphomas being the only two exceptions since they came out with specular correlations, probably a natural consequence of living longer. Some illnesses (10/34) were more typical for poor living conditions (high % GP1) such as TBC, STD, strokes, peptic ulcer, CVD, and digestive diseases, among non-cancer diseases, and stomach, liver, and cervix among cancers (see Table 9).
Other diseases (6/34) did not belong to any of the LEEDELs (see Table 5: variable = 0) all were cancers (breast, bladder, brain, thyroid and leukemia) a part of glomerulonephritis. A couple of issues should be mentioned concerning cell phones and PM.
The cell phones
The cell phones have been addressed as a cause of cancer by a consistent number of authors.
Based on research reports done before 2014, the electromagnetic field (EMF) produced by mobile phones was classified by the international Agency for Research on Cancer (IARC) as possibly carcinogenic to humans [15]. More recently, the European EMF guidelines were established [16], addressing all the possible sources of pollution (e.g. cell, tablets, TV broadcast antennas), concluding that certain diseases such as Alzheimer and male infertility may be the consequences of this event.
The American Cancer Society (ASC) in 2018 stated that the reports of the US National Toxicology Program (NTP) “were still inconclusive, and that, so far, a higher cancer risk in people has not been seen, but that people who concerned should wear an earpiece when using the cell phone” [8].
In the present research, the only significant correlations were shown for pancreatic cancer and chlamydia infection in females. No other diseases were emerging, and brain cancer seemed to be unaffected.
However, the activity of EMF was documented to reduce insulin secretion from in vitro insulinoma [17] and in rats the exposure to EMF impacts insulin secretion by influencing the size of pancreatic islets [18].
On the basis of experimental studies, suggestions were made to enhance intracellular insulin concentration in insulin-secreting cells in that they could be useful for cell transplantation in diabetes mellitus [19].
More recently the High-Frequency EMF was found to modify both insulin secretion and blood glucose levels in rats [20].
In humans, for the moment it is not documented whether EMF increases or decreases the insulin secretion in diabetes type 2 (2DM). In a research done using the same ASDRs as in the present study [35], 2DM was shown to reduce the risk of pancreatic cancer, which may mean that blood glucose increases and hyper insulinemia are not culprits of the cancer development. More attention should be paid to the reduction of pancreas cells apoptosis driving them toward the malignancy. In other terms, under EMF stimulation, no matter whether the influence is positive or negative, it seems evident the Langherans islets can be affected.
There is no clear explanation about the relationship between cell phones and pancreatic cancer in humans. However, when cell phones are not used but still operating, usually they are kept in the pockets or in the bags: the relative EMF can impact easily the anatomic position of pancreas which is very close.
Chlamydia also was positively correlated with cell phones, and despite no specific data are available in the literature, this infection could be affected by EMF. The sensitivity of bacteria to EMF has been documented with conflicting results. Some authors described for both Gram-positive and Gram-negative bacteria a reduction of growth together with a morphology modification [21], while more recently other authors showed a growth increase of some E. coli strains using irradiation frequencies between 60 and 40 Hz [22]. The differences between results could be determined by the experimental conditions, particularly by the frequencies which were used, or even by the anatomical parts where bacteria were isolated [23]. One aspect should be analyzed in that angiogenesis seems to be stimulated by EMF [24,25]. Although all these investigations should be confirmed, the hypothesis seems consistent that the angiogenesis stimulation may allow chlamydia to spread locally, and also far from the common anatomical part were usually it resides.
PM value
This variable has some peculiar aspects that need to be clarified. The first is that PM values were relative to cities with >100,000 inhabitants which represent only a part of the total population. Furthermore, PM is a complex mixture of chemical components, to be considered together with many gases such as methane (CH4), ozone (O3), carbon monoxide (CO), sulfate (SO3), nitrogen dioxide (NO2) aerosols, and all the possible widespread air pollutants present wherever people live. These particles are able to penetrate deeply into the respiratory tract, and therefore constitute a risk for health. The WHO estimated in 2000 that the exposure to PM caused 800,000 deaths and 6.4 million years lived with disability (YLDs) in the developing countries accounting for two thirds of this burden [26].
In general, WHO stated that there is no evidence of a safe level of exposure to PM or a threshold below which no adverse health effects occur. In the recent study, >30 % of the population was found to live in areas exceeding the WHO level target of 35 mcg/m3. This safe limit was reached only in some of 49 SC countries, and the levels were found to be even worse in the remaining countries (see Table 2).
Furthermore, the data recorded in this study represent an average of the cities where the monitoring stations were available. In order to present air quality largely representative for human exposure, measurements of residential areas, commercial and mixed areas were used.
Stations characterized as particular “hot spots” or exclusively industrial areas were not included, and in some of the country’s particles < PM10 was largely based on estimates [27].
There are several studies conducted in different parts of the world showing the negative effect of the PM on health [26-30], but still there is need for further research to define the long term toxicity [31] and whether some components and sources of PM may be more toxic than others [32]. The indoor air pollution is also something that should be considered since it is causing apparently 3.7 million deaths [33].
In the WHO Update report of 2016 [34] a comparison was done to determine the trend of PM in the world between 2008 and 2013, ending up with an estimation of 5% increase, despite some fluctuation within the macro-regions that were analyzed. In the same period the LE was also increased in practically every of the 191 countries considered in this study, no matter whether the PM was increasing or not. This indicates that more precise measures should be taken for PM, because in the present scenario it seems that they have some positive effect on LE. The present findings of a negative correlation with Alzheimer’s disease (a decrease of Alzheimer corresponding to an increase of PM) and positive correlation with ischemic stroke (an increase of ischemic stroke corresponding to an increase of PM) have no clear explanation, unless some hypotheses about microvascular thrombosis, and brain inflammation is made.
CONCLUSION
The most interesting issues emerging from the present study were the non-interference of the classical ecological variables on LE, a part of PM showing positive and negative interference respectively for Alzheimer’s disease and ischemic stroke. In relation to the illnesses in general, it seemed evident they have different patterns, most of the time showing that welfare variables (GDP, cars, internet connections) have a positive effect in reducing the burden of ASDRs.
Despite being limited to the 49 SC, the world tendency is to live longer and keep the diseases under control through the improvement of life style and financial resources. For some diseases this is not sufficient since, at the opposite, they may appear late in the age such as Alzheimer’s disease and lymphoma.
An interesting finding concerns the connection between pancreatic cancer and EMF pollution, witnessing that the increase of cell phones use may be relevant to the increase of this cancer which was the only disease growing significantly (+7%) in the period from 2000 and 2016.
It is time that ecologists, climatologists and clinicians started a crosstalk…. it’s never too late, provided they are minded the solutions reside in the evolution and never in the revolution.
ACKNOWLEDGEMENT
We are thankful to the WHO that allowed the public availability of the data base: the use of these data can be extremely helpful for authors who need details on the epidemiology of different diseases.
AUTHOR CONTRIBUTIONS
Cornelli U conceived the trial, retrieved some of the WHO data and wrote the article; Belcaro G retrieved part of the WHO data; Martino Recchia was responsible for the statistical analysis.
All the authors read and approved the final manuscript.
FUNDING
No funding was requested or received by the authors.
CONFLICT OF INTEREST
No conflict of interest.
1. USGCRP (2017) Climate Science Special Report: Fourth National Climate Assessment, Volume I [Wuebbles, DJ, Fahey DW, Hibbard KA, Dokken DJ, Stewart BC, et al.] U.S. Global Change Research Program, Washington, DC, USA, pp: 470.
2. Cook J, Oreskes N, Doran PT, Anderegg WRL, Verheggen B, et al. (2016) Consensus on consensus: A synthesis of consensus estimate on human-caused global warning. Env Res Letter 11: 04822.
3. Ceballos G, Erlich PR, Barnosky AD, García A, Pringle RM, et al. (2015) Accelerated modern human-induced species loss: Entering the sixth mass extinction. Sci Adv 1: e1400253.
4. Worm B, Barbier EB, Beaumont N, Duffy JE, Folke C, et al. (2006) Impact of biodiversity on ocean ecosystem services. Science 314: 787-790.
5. Ripple WJ, Wolf C, Newsome TM, Barnard P, Moomaw WR (2019) World scientists’ warning of a climate emergency. Bioscience 70: 8-12.
6. Trenberth KE (2018) Climate change caused by human activities is happening and it already has major consequences. JERL 36: 463-481.
7. Murthaugh PA, Schlax MG (2009) Reproduction and the carbon legacies of individuals. Global Env Change 19: 14-20.
8. Global Health Estimates (2016) Death by cause, age, sex, by country and by region 2000-2016. Geneva World Health Organization 2018.
9. Atlante Geografico DE Agostini (2016) Ed De Agostini Novara Italy.
10. The CIA World Factbook (2017) Ed Skyhorse Publishing.
11. Street JO, Carroll RJ, Ruppert D (1988) A note on computing Robust Regression estimates via iteratively reweighted least squares. The AM Statistician 42: 152-154.
12. Huber PJ, Statistics R (1981) Hoboken, NJ, John Wiley & Sons, Inc.
13. Cornelli U, Recchia M, Grossi E, Belcaro G (2018) Life expectancy does not depend on classical ecological variables: Stochastic and non-stochastic analysis. GSL J Pub Heath Epidemiol 1: 104.
14. FAO Sustainable Development Goals (2017) Zero Hunger 2017. Available online at: https://www.facebook.com/ ZeroHungerChallenge
15. WHO (2014) Electromagnetic fields and public health: Mobile phones.
16. Belyaev I, Dean A, Eger H, Hubmann G, Jandrisovits R, et al. (2016) European EMF guidelines for the prevention, diagnosis and treatment of EMF-related health problems and illnesses. Rev Environ Health 31: 363-367.
17. Sakurai T, Satake A, Sumi S, Inoue K, Miyakoshi J (2004) An extremely low frequency magnetic field attenuates insulin secretion from the insulinoma cell line, RIN-m. Bioeloctromagnetics 25: 160-166.
18. Khakai AA, Ali-Hemmati A, Nobaharu R (2015) A study of the effect of electromagnetic field on islets of Langherans and insulin release in rats. Crescent J Med BiolSci 2:1-5.
19. Sakurai T, Yoshimoto M, Koyama S, Miyakoshi J (2008) Exposure a extremely low frequency magnetic field affects insulin-secreting cells. Bioelectromagnetics 29: 118-124.
20. Paraš SD, Gajanin RB, Manojlović ML, Ružić ZN (2018) Impact of High-frequency electromagnetic fields on secretion and structure of pancreas in rats. IFMBE Proceeding 65.
21. Inhan-Garip A, Aksu B, Akan Z, Akakin D, Ozaydin AN, et al (2011) Effect of extremely low frequency electromagnetic fields on growth rate and morphology of bacteria. Int J Radiat Biol 87: 1155-1161.
22. Chen Y, Cai ZZ, Feng Q, Gao P, Yang Y, et al. (2019) Evaluation of the extremely-low-frequency electromagnetic field (ELF-EMG) on growth of bacteria Escherichia coli. Biol Eng Med.
23. Crabtree DPE, Herrera BJ, Kang S (2017) The response of human bacteria to static magnetic field and radiofrequency electromagnetic field. J Microbiology 55: 809-815.
24. Yen-Patton GPA, Patton WF, Beer DM, Jacobson BS (1988) Endothelial cell response to pulsed electromagnetic fields: stimulation of growth rate and angiogenesis in vitro. J Cell Physiol 134: 37-46.
25. Monache DS, Alessandro R, Iorio R, Gualtieri G, Colonna R (2008) Extremely low frequencies electromagnetic fields (ELF-EFMs) induce in vitro angiogenesis process in human endothelial cells. Biolectromagnetics 29: 640-648.
26. Cohen AJ, Anderson HR, Ostro B, et al. (2004) Comparative of health risks: Global and regional burden of disease attributable to selected major risk factors. 1st ed. Vol. Vol.2. World Health Organization Geneva, pp: 1353-1453.
27. Brauer M, Amann M, Burnett RT, Cohen A, Dentener F, et al. (2012) Exposure assessment for estimation of the global burden of disease attributable to outdoor pollution. Environ. Sci Technol 46: 652-660.
28. Lippmann M, Chen LC, Gordon T, Ito K, Thurston GD (2013) National Particle Component Toxicity (NPACT) initiative: Integrated epidemiologic and toxicologic studies of the health effects of particulate matter component. Res Rep Health Eff Inst 177: 5-13.
29. Crouse DL, Peters PA, Hystad P, Brook JR, van Donkelaar A, et al. (2015) Ambient PM 2.5, O3, and NO2 exposures and associations with Mortality over 16 years of follow-up in the Canadian Census Health and Environment cohort (CanChec). Environ Health Perspect 123: 1180-1186.
30. Baccarelli AA, Hales N, Burnett RT, Jerrett M, Mix C, et al. (2016) Particulate air pollution, exceptional aging and rate of centenarians: A nationwide analysis of the United States, 1980-2010. Environ Health Perspect 124: 1744-1750.
31. Henschel S, Atkinson R, Zeka A, Le Tertre A, Analitis A, et al. (2012) Air pollution interventions and their impact on public health. Int J Public Health 57: 757-768.
32. Adams K, Greenbaum DS, Shaikh R, Van Erp AM, Russell AG (2015) Particulate matter components, sources, and health: Systematic approaches to testing effects. J Air Waste Assoc 65: 544-558.
33. WHO (2016) World Health Assembly closes, passing resolution on air pollution and epilepsy.
34. WHO (2016) WHO’s Urban Ambient Air Pollution database-Update 2016.
35. Cornelli U, Belcaro G, Recchia M. (2020) Diabetes type II in correlation to non-cancer and cancer diseases in 49 WHO selected countries (SC) on the base of Age Standardized Death Rate (ASDR).
-
 Table 1
 -
Table 2
-
Table 3
-
Table 4
-
Table 5
-
Table 6
-
Table 7
-
Table 8
-
Table 9
-
Table 10
-
Table 11
-
Table 12
-
Table 13
-
Table 14
-
Table 15
-
Table 16
-
Table 17
-
Table 18
-
Table 19
-
Table 20


QUICK LINKS
- SUBMIT MANUSCRIPT
- RECOMMEND THE JOURNAL
-
SUBSCRIBE FOR ALERTS
RELATED JOURNALS
- Journal of Allergy Research (ISSN:2642-326X)
- Journal of Neurosurgery Imaging and Techniques (ISSN:2473-1943)
- Journal of Nursing and Occupational Health (ISSN: 2640-0845)
- International Journal of Radiography Imaging & Radiation Therapy (ISSN:2642-0392)
- Journal of Infectious Diseases and Research (ISSN: 2688-6537)
- Advance Research on Alzheimers and Parkinsons Disease
- Journal of Oral Health and Dentistry (ISSN: 2638-499X)